
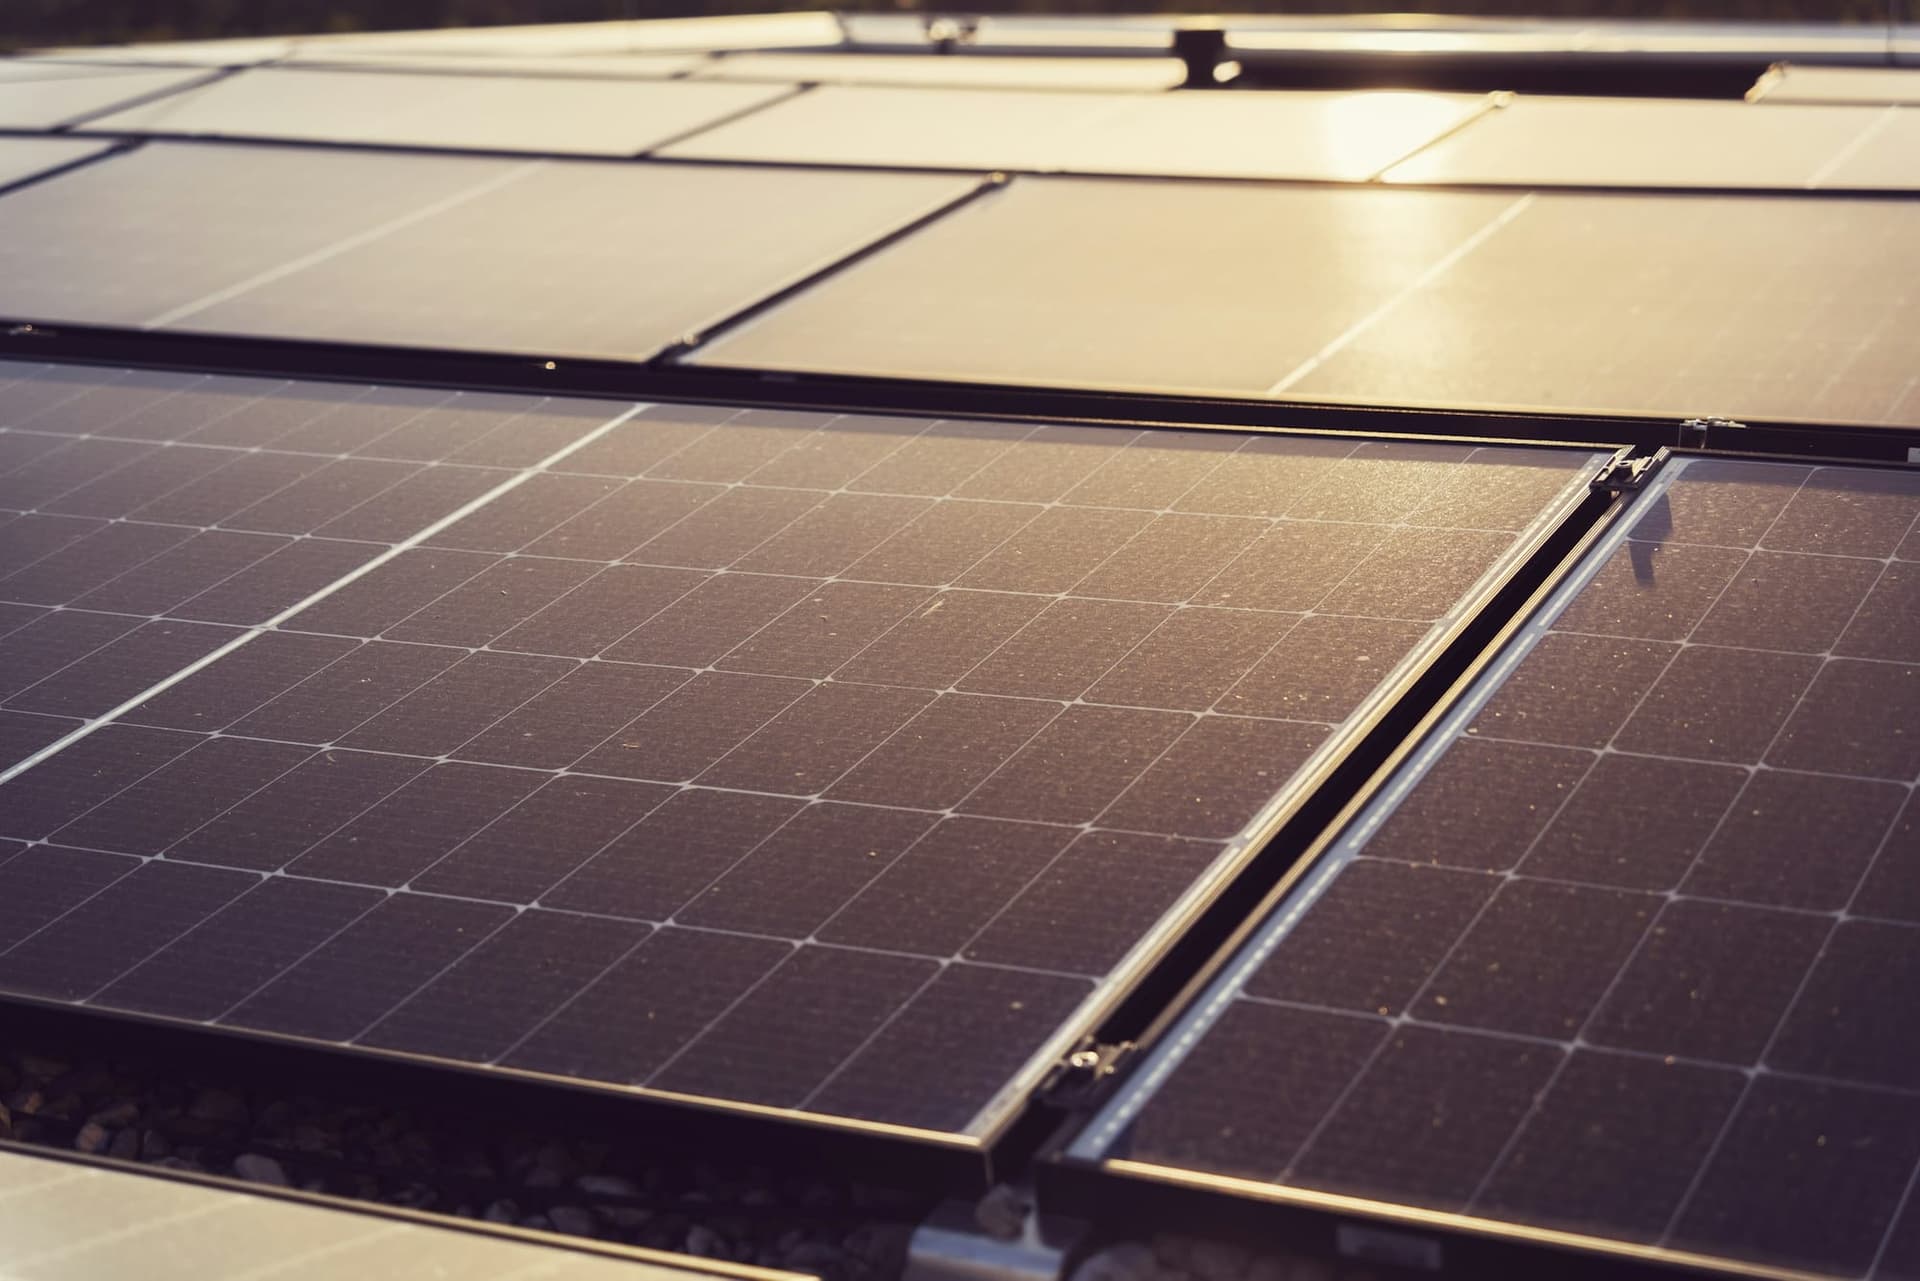
Short answer: yes, heat lowers what a solar panel produces at that moment, and no, it does not change the fact that the Antelope Valley is one of the best places in California to own solar. A panel on a Palmdale roof at 3 p.m. in July gives up roughly a tenth of its rated power to temperature. It makes that up, and then some, with about 6.2 peak sun hours a day and skies that are clear or mostly clear 89% of the time in late summer. The trick is to design for the heat instead of pretending it is not there.
What the number on the panel actually means
A “400-watt” panel makes 400 watts at Standard Test Conditions: 1,000 watts of sunlight per square meter, air mass 1.5, and a cell temperature of 25°C (77°F). That is a lab condition. On a roof, the cell inside the glass runs much hotter than the air around it because it is dark, it is in full sun, and it is a few inches from a shingle roof that is also in full sun. Datasheets give a second, more realistic rating called NMOT (nominal module operating temperature), measured at 800 W/m² with 20°C air and a light breeze. For current panels it lands in the mid-40s Celsius. On a Palmdale summer afternoon the cell goes well past that.
The temperature coefficient
Every panel datasheet lists a temperature coefficient of power: how much output falls for each degree Celsius the cell rises above 25°C. Two examples from panels sold in our market:
- REC Alpha Pure-R (heterojunction cells): −0.24% per °C.
- Qcells Q.TRON BLK M-G2+ (n-type TOPCon cells): −0.29% per °C.
Older PERC panels, and most panels installed in the valley before about 2022, have noticeably worse coefficients than these. That is one reason we favor n-type cells for desert roofs even when a cheaper panel has the same wattage on paper.
Now the arithmetic. Say the cell reaches 65°C on a hot afternoon, 40 degrees above the test condition. A −0.29%/°C panel loses 40 × 0.29 = about 11.6% of its rated power. A −0.24%/°C panel loses about 9.6%. That is the “roughly a tenth” from the top of this guide. Push the cell to 75°C on a still, 105°F day over a dark roof and the loss is closer to 12–15%. REC’s own datasheet lists 80°C (176°F) as the module’s 98th-percentile operating temperature, so these are ordinary conditions the panel is built for, not abuse.
Why the annual total is still excellent here
Temperature is a percentage; sunlight is the base it multiplies. Palmdale averages about 6.2 peak sun hours per day for a fixed-tilt array, among the highest figures in the state. Weather Spark’s climate data for Palmdale puts July highs at 93–96°F and the hottest stretch around August 2, and at the same time puts the sky at clear, mostly clear or partly cloudy 89% of the time. A coastal roof runs cooler but loses far more to marine layer and haze than we lose to heat. When we model the same 8 kW system in Palmdale or Lancasteragainst a coastal city, the high-desert roof wins on annual kilowatt-hours despite the summer derate.
Where heat actually costs you money: 4 to 9 p.m.
Under SCE’s Net Billing tariff, the hours that matter are summer weekday evenings. That is when TOU-D-PRIME prices peak and when export credits are highest. Heat hits production hardest in the mid-afternoon, then the sun drops and output falls off regardless of temperature. So a hot day compresses the useful window a little and shifts more of your evening load onto the grid. We covered the tariff in detail in our NEM 3.0 guide; the short version is that a battery charged from midday production and discharged from 4 to 9 p.m. is how you stop the heat from turning into an SCE bill. See the battery storage page for the options we install.
Design choices that keep panels cooler
Airflow behind the panel
Standard rail mounting leaves a gap of several inches between the panel and the roof so air can move underneath. That gap is the single biggest thermal decision on the job. Flush or building-integrated mounting with no air channel raises module temperature by 10°C or more according to PV Education’s NOCT reference, which is another 3% of output gone on every hot day for the life of the system.
Roof color and material
A light concrete tile roof stays cooler than dark composition shingle, and the panel above it runs cooler too. We cannot change your roof, but we do account for it: the modeling tool we use applies a higher nominal cell temperature for roof-mounted arrays than for open racks, and we tell it which roof you have.
Electronics with desert ratings
Microinverters and optimizers sit under the panels in the same heat. Enphase rates its IQ8 series microinverters for ambient temperatures from –40°C to 60°C (–40°F to 140°F) in a NEMA 6 outdoor enclosure, which covers anything an Antelope Valley roof will see. String inverters and batteries are a different story: they belong on a shaded wall or in the garage, not on a west-facing stucco wall that bakes from noon to sunset.
Battery placement
Tesla’s Powerwall 3 datasheet lists an operating range of –20°C to 50°C (–4°F to 122°F), rates the unit for indoor and outdoor installation, and notes that performance may be de-rated above 40°C (104°F). Air temperature in the shade rarely reaches that here, but a battery in direct afternoon sun is not in the shade. Our default in Palmdale, Lancaster and Rosamond is a garage wall or a north-facing exterior wall, and we will tell you if your home does not have a good spot.
Wind and dust, the other two desert variables
Wind helps. Moving air pulls heat off the back of the panel, which is why the valley’s breezy spring afternoons are some of the best producing days of the year. It also means we anchor to the rafters with hardware rated for the local wind loads, not the generic attachment count a lower bidder might use. Dust hurts. A fine film of desert dust and the occasional dust storm cut light before it reaches the cell, and rain here is too rare to count on for cleaning. We show you what your monitoring should look like and when a rinse is worth it; details are on our maintenance and repair page.
How we model it for your roof
We do not estimate production with an annual rule of thumb. Our design software runs the NREL PVWatts model hour by hour against typical-year weather for your address: the sunlight, the air temperature and the wind speed for every hour of the year. It calculates the cell temperature from those inputs and your mounting type, applies the exact temperature coefficient of the panel we are quoting, and only then adds inverter, wiring and soiling losses. The result is a production figure that already includes the August afternoons. If you have been given a number by someone else, ask them the same question we ask ourselves: was this modeled with local weather and your panel’s coefficient, or was it the STC rating times a sun-hours figure?
If you want that model run for your own home, send us a recent SCE bill and the roof you have. Our residential solar page explains what happens next, and the estimate is free.
Sources
- REC Alpha Pure-R datasheet (temperature coefficient −0.24%/°C, STC and NMOT definitions, 80°C T98 operating temperature)
- Qcells Q.TRON BLK M-G2+ datasheet (temperature coefficient of PMPP −0.29%/K, STC 25°C)
- Sandia PV Performance Modeling Collaborative: the PVWatts DC power and cell-temperature model
- PV Education: Nominal Operating Cell Temperature and the effect of mounting on module temperature
- Enphase IQ8 Series microinverter datasheet (ambient temperature range, NEMA 6 enclosure)
- Tesla Powerwall 3 datasheet (operating temperature, indoor/outdoor rating, de-rating above 40°C)
- Weather Spark: Palmdale year-round climate (July highs, clear-sky percentage, wind)
- TurbineGenerator.org: Palmdale peak sun hours
- SCE: How Solar Billing Plans work (TOU-D-PRIME, evening peak pricing)